
July 1997 Volume 3 Issue 13
Saving Dollars through Electrical Demand Control
Electric utility rates for industrial and commercial customers are based both on energy consumption (kWh), and on peak demand — on the maximum kW or kVA load during the billing period. Not only is there a direct demand charge that is proportional to peak demand, but peak demand also determines how much of the billing period’s energy gets charged at the expensive “first block” rate, and how much is charged at the cheaper “second block” rate. The higher the peak demand, the more kilowatt-hours that are charged at the expensive rate.
For industrial customers at the present time, reducing peak demand by just one kW typically reduces the electricity bill by about $10 per month or $120 per year. Clearly, one of the most direct and effective ways of reducing a facility’s electricity bill is to reduce peak demand.
THE ELECTRICAL ENERGY AUDIT
Your electricity bill will tell what your demand-related costs are, but it won’t give any hints about how to reduce those costs. It is an electrical energy audit that provides the needed information. If your facility has not yet had one, or if there have been changes since your last one, call Ron Estabrooks or Mike Proud at 1-800-236-5193 (toll free). These audits are cooperative efforts in which you supply billing history, we set up equipment that creates a 24-hour demand profile, and we all work together to create an accurate load inventory.
The Demand Profile
The bill tells us what the maximum load was during the billing period, but it doesn’t identify the time of day it occurred or what loads were connected at the time. The time-of-day part of the puzzle is pinned down by a demand profile such as the one shown below.
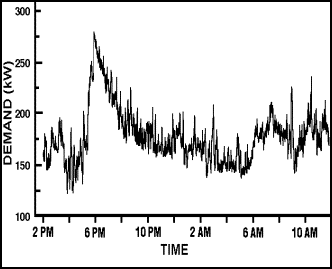
We see that on this particular day a peak of 280 kW occurred at about 6 p.m.
The Load Inventory
The load inventory helps us figure out what loads produced the demand peak. It is simply a list of all the significant electrical loads in the facility, and the kW that each contributes to overall demand when that load is ON. With this list of equipment in hand, and a little time spent checking to see which units are operating when the demand peak occurs, we are in a position to determine if there is any way to reduce that peak.
IDENTIFYING OPPORTUNITIES
Our sample demand profile is typical of those encountered in fish processing plants. That sharp 6 p.m. peak is the result of starting, within a few minutes of each other, several high-demand freezers
to freeze the fish just cleaned and packed. We can see from the graph that the total load switched ON between 5:45 and 6:00 was about 110 kW. The gradual drop in demand from 6 p.m. to 10 p.m. occurs as the product freezes and the thermal load on the refrigeration equipment goes down. Note especially the period shortly after the peak. In less than an hour, the demand dropped 40 kW — from 280 kW down to 240 kW. If there was a way to keep the peak from ever rising above 240 kW this would save roughly $400 per month or $4800 per year, based on our $10 per kW rule of thumb.
In this situation there are two possibilities worth looking into. One is to stagger the turn-on time of the several freezers, rather than turning them all on at once. The second is to see if some of the 170 kW base load (the load that was present when those freezers were first turned on) could be turned off for the first hour or two that the freezers are in operation. This is the kind of thinking that is needed at this stage. We ask, “What, in theory, might be done differently to reduce the demand?”
RUNNING EXPERIMENTS
Once a promising approach has surfaced, it is time to run an experiment to see if it works. Without buying any fancy new equipment, see if you can try the proposed scheme manually, simply by switching equipment on and off at the appropriate times. If the demand-recording equipment is still attached when you do this, it will create a new demand profile which you can then compare with the first one. What you learn may lead to still other experiments, and to further refinement of your demand reduction scheme.
FIGURING OUT HOW TO DO IT AUTOMATICALLY
Once you have figured out how to reduce the demand without causing other problems, the next step is to figure out how to do it automatically. At this point you might want to discuss the situation with your electrician or a controls expert.
Simple Switch Interlocks
Sometimes the solution is as simple as ensuring that whenever equipment A is ON, equipment B is OFF. In our example, let’s say we discovered that part of the 170 kW base load is a 50 kW ice-making machine. It turns out that the ice could be made later, and that turning the ice machine OFF for the first two hours that the freezers are ON would cause no problems. This could be done with a few inexpensive electrical components — several relays and a timer.
Meters that alarm, and shed loads
Some situations are more complex than the one described, and simply trading load A for load B is not the answer. Of use in many of these situations is a meter that measures kW or kVA and closes a set of contacts when the measured demand reaches a preset level. The contact closure can be used to set off an audible alarm, or to automatically turn off non-essential loads. Furthermore, if linked to a computerized process controller, a meter of this kind can initiate much more complex kinds of demand control.
OTHER TECHNIQUES
We end this article by mentioning three other demand-reduction techniques worth considering:
1. If your facility has a short-duration demand peak and a standby electric generator, consider reducing the peak by switching some loads to the generator.
2. Consider the number of electric meters and billing accounts that your firm has. If a facility has two meters, and their demand peaks occur at different times of the day, switching to a single account and one meter might save money. On the other hand, sometimes a facility is open all year, but the heavy electricity use occurs only in the summer. Here it might make sense to have the seasonal loads metered separately, and to close that account when the summer processing season has ended. Much depends on electric rate eligibility. Feel free to discuss your situation with Ron Estabrooks or Mike Proud at 1-800-236-5193 (toll free).
3. If your facility’s demand is metered in kVA, remember that power factor correction usually reduces demand-related charges significantly, and that electricity-bill savings often pay back the capital cost within two years.